Context
The process of issuing student IDs in DTU takes a long time, three weeks on average. The student cards offer access in the buildings and cantine discounts (40%), therefore students need the cards as soon as possible.
Therefore, the purpose of the project is to investigate the work and service system of DTU student IDs production and delivery and offering redesign solutions for the discovered problems.
Process
We used a combination of the Double Diamond Method and the Work System Method to guide us in the design process.

Discover phase
In order to define the problem and to map out the current process we did interviews with relevant stakeholders and a survey for the international students.
Interviews
-
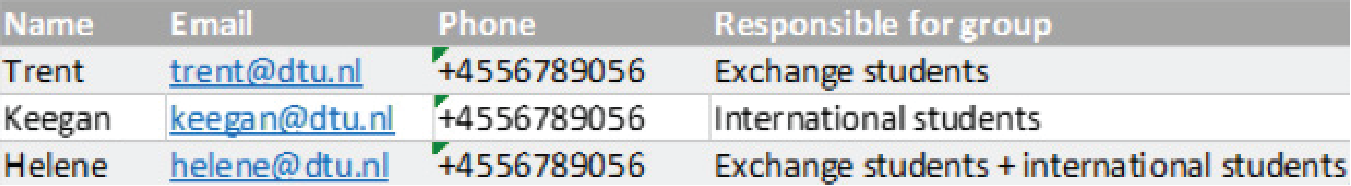
The first two interviews were with two workers (Trent and Keegan) of the International and Administration Offices of DTU that had knowledge about the involved parts of the system. Using the gathered information, about the physical part of the system, we created the Stakeholder Overview and a first draft of the Swimlane Diagram. We obtained the contacts of other key stakeholders involved in the system. Keegan suggested that they think about buying a capable printer in order to do printing inside DTU.
We decided to focus on the international students because the Danish ones receive their cards at home before the school year starts.
-
Next interview was with two (Ian and Bo) of the responsible people for the IT and security services of DTU. The obtained information was regarding how the process is perceived from the IT point of view, what is currently done, how the student card system works from an IT point of view and what is doable from their expertise. We found out that they can print some of the cards internally, but they don’t have the resources to print all the cards. They also strongly suggested buying a capable printer in order to do printing inside DTU.
-
Next interview was with Victoria from another university in Copenhagen (CBS). CBS an inhouse printing system with printers from Sagio, so we wanted to find out if this solution is worth pursuing. She explained the process in detail:
- In peak periods -semester start- they have 28 student workers working in shifts from 08:00 – 18:00 for around 2 weeks approving pictures and printing cards among other tasks
- They have 3 printers of approx. 55.000dkk/printer that have a lifespan of +/-5 years. The printers need a software licence with a price of 50.000dkk/month.
We decided to avoid this solution becasue it involves too many resources and we can suggest a better redesign.
-
Last interview was with Camilla from another university in Copenhagen, KU, where the cards are also printed by Sagio. We found out that Sagio’s process takes 3-5 days, therefore this helped us take Sagio out of the scope of the project.

Survey
The survey had 53 responses and targeted international students. It was used to validate the problem and explore other existing problems.

The most common problems (aside from waiting time) the students found were:
- Knowing whether your card is in progress (66.7% of responses)
- Communication from DTU about uploading a picture (47.5% of responses)
- Knowing whether your picture was approved (36.1% of responses)
- Finding the link to upload the picture (25% of responses)
- Using the upload picture page from DTUBasen.dtu.dk to upload the picture (22.2% of responses)
Define phase
The process is very complicated and confusing, therefore we used multiple methods to map it down.
We started with the SIPOC diagram in order to gain an overview of inputs and outputs in the system and who supplies what to whom during the card creation process.

The snapshot was a good way to gain an overview of all the different stakeholders and the different artefacts in the system, such as information and products.

Based on the survey responses and the discussions with some students, we created a persona and her customer journey in relation to the system.
- The wait time is a big problem for the customer
- The interactions and touchpoints are mainly digital.
- The students may have many questions throughout the process.

In order to understand the relationships between the different organisational units and the processes that each of these units perform we mapped the organisational ergonomics within the current situation.

Providing students with cards requires several manual steps to follow. To visualize and comprehend each of this activities, a hierarchical task analysis has been mapped. The detected issues are:
- Each card arrives with a letter, and they need to be matched together and put into envelopes which leads to excessive work.
- Manually typing student numbers and sending emails creates mistakes.
- No efficient ordering and storage method.

The swimlane diagram is the one that mapps the process taking into consideration the order od the activity and the stakeholder that does it. It is the final and most illustrative method we used.

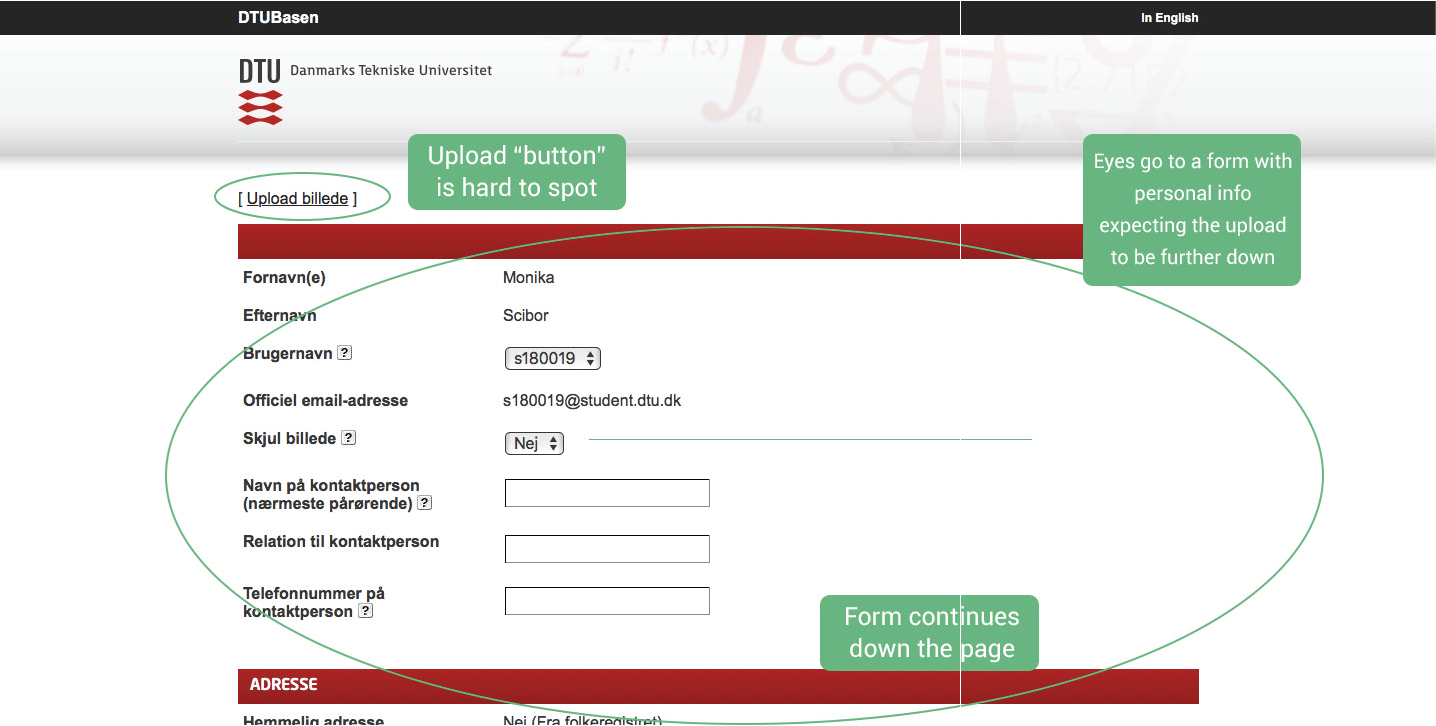
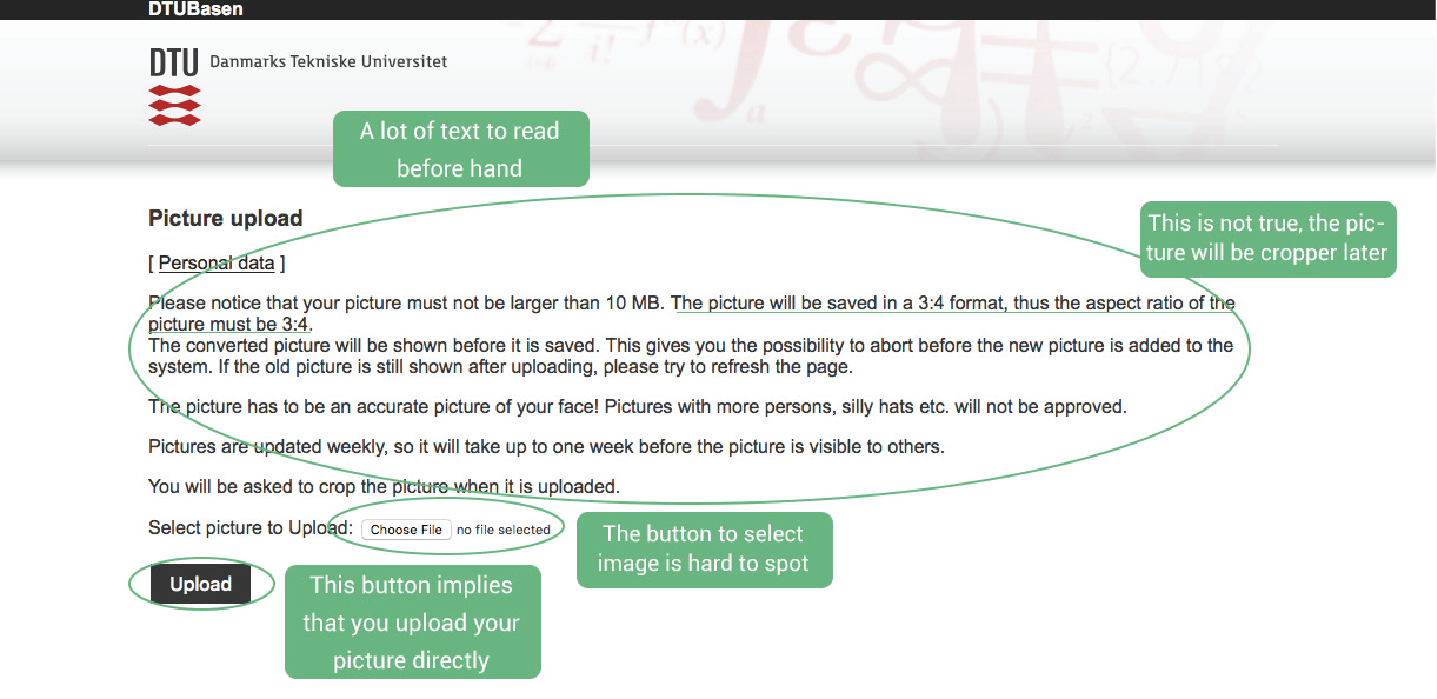
The cognitive ergonomics were considered for the interface where the students upload their picture. It was done by looking at the screens from a UX point of view.
Main points were:
- upload button is hard to spot
- there is a lot of text
- the need to crop image is not obvious
Test with users:
- 4 out of 4 did not see the upload button at first
- 0 out of 4 read all of the text
- 3 out 4 did not understand that they had to crop
Next, we did a small affinity diagram to collect all the issues and points from our field work and analysis. This resulted in the problem focus with three different categories: lack of information, workspace ergonomics and student ergonomics. This diagram helped in identifying the breakdowns of the system.


Develop & Deliver phases
We brainstormed possible redesign solutions focusing on one breakdown at a time. Each solution was analysed and we chose to offer short term redesign solutions because the system needs immediate improvement and long term ones which will be much more efficient. The some of the diagrams were redone to illustrate the redesignes system and to prove that a lot of the unnecesary steps were removed.
Breakdown 1
Short term solution: The International Office incorporates a section with personnel responsible of approving pictures. During peak periods (semester start) it consists on their main task. A list of responsible persons (which can be consulted by Administra- tion Office) is created with the responsible names, assigned pictures to approve and contact details.

Organisational ergonomics for the redesigned system.
Long term solution: Use machine learning tools to analyze and approve the picture as replacement for employee.
Breakdowns 2&3
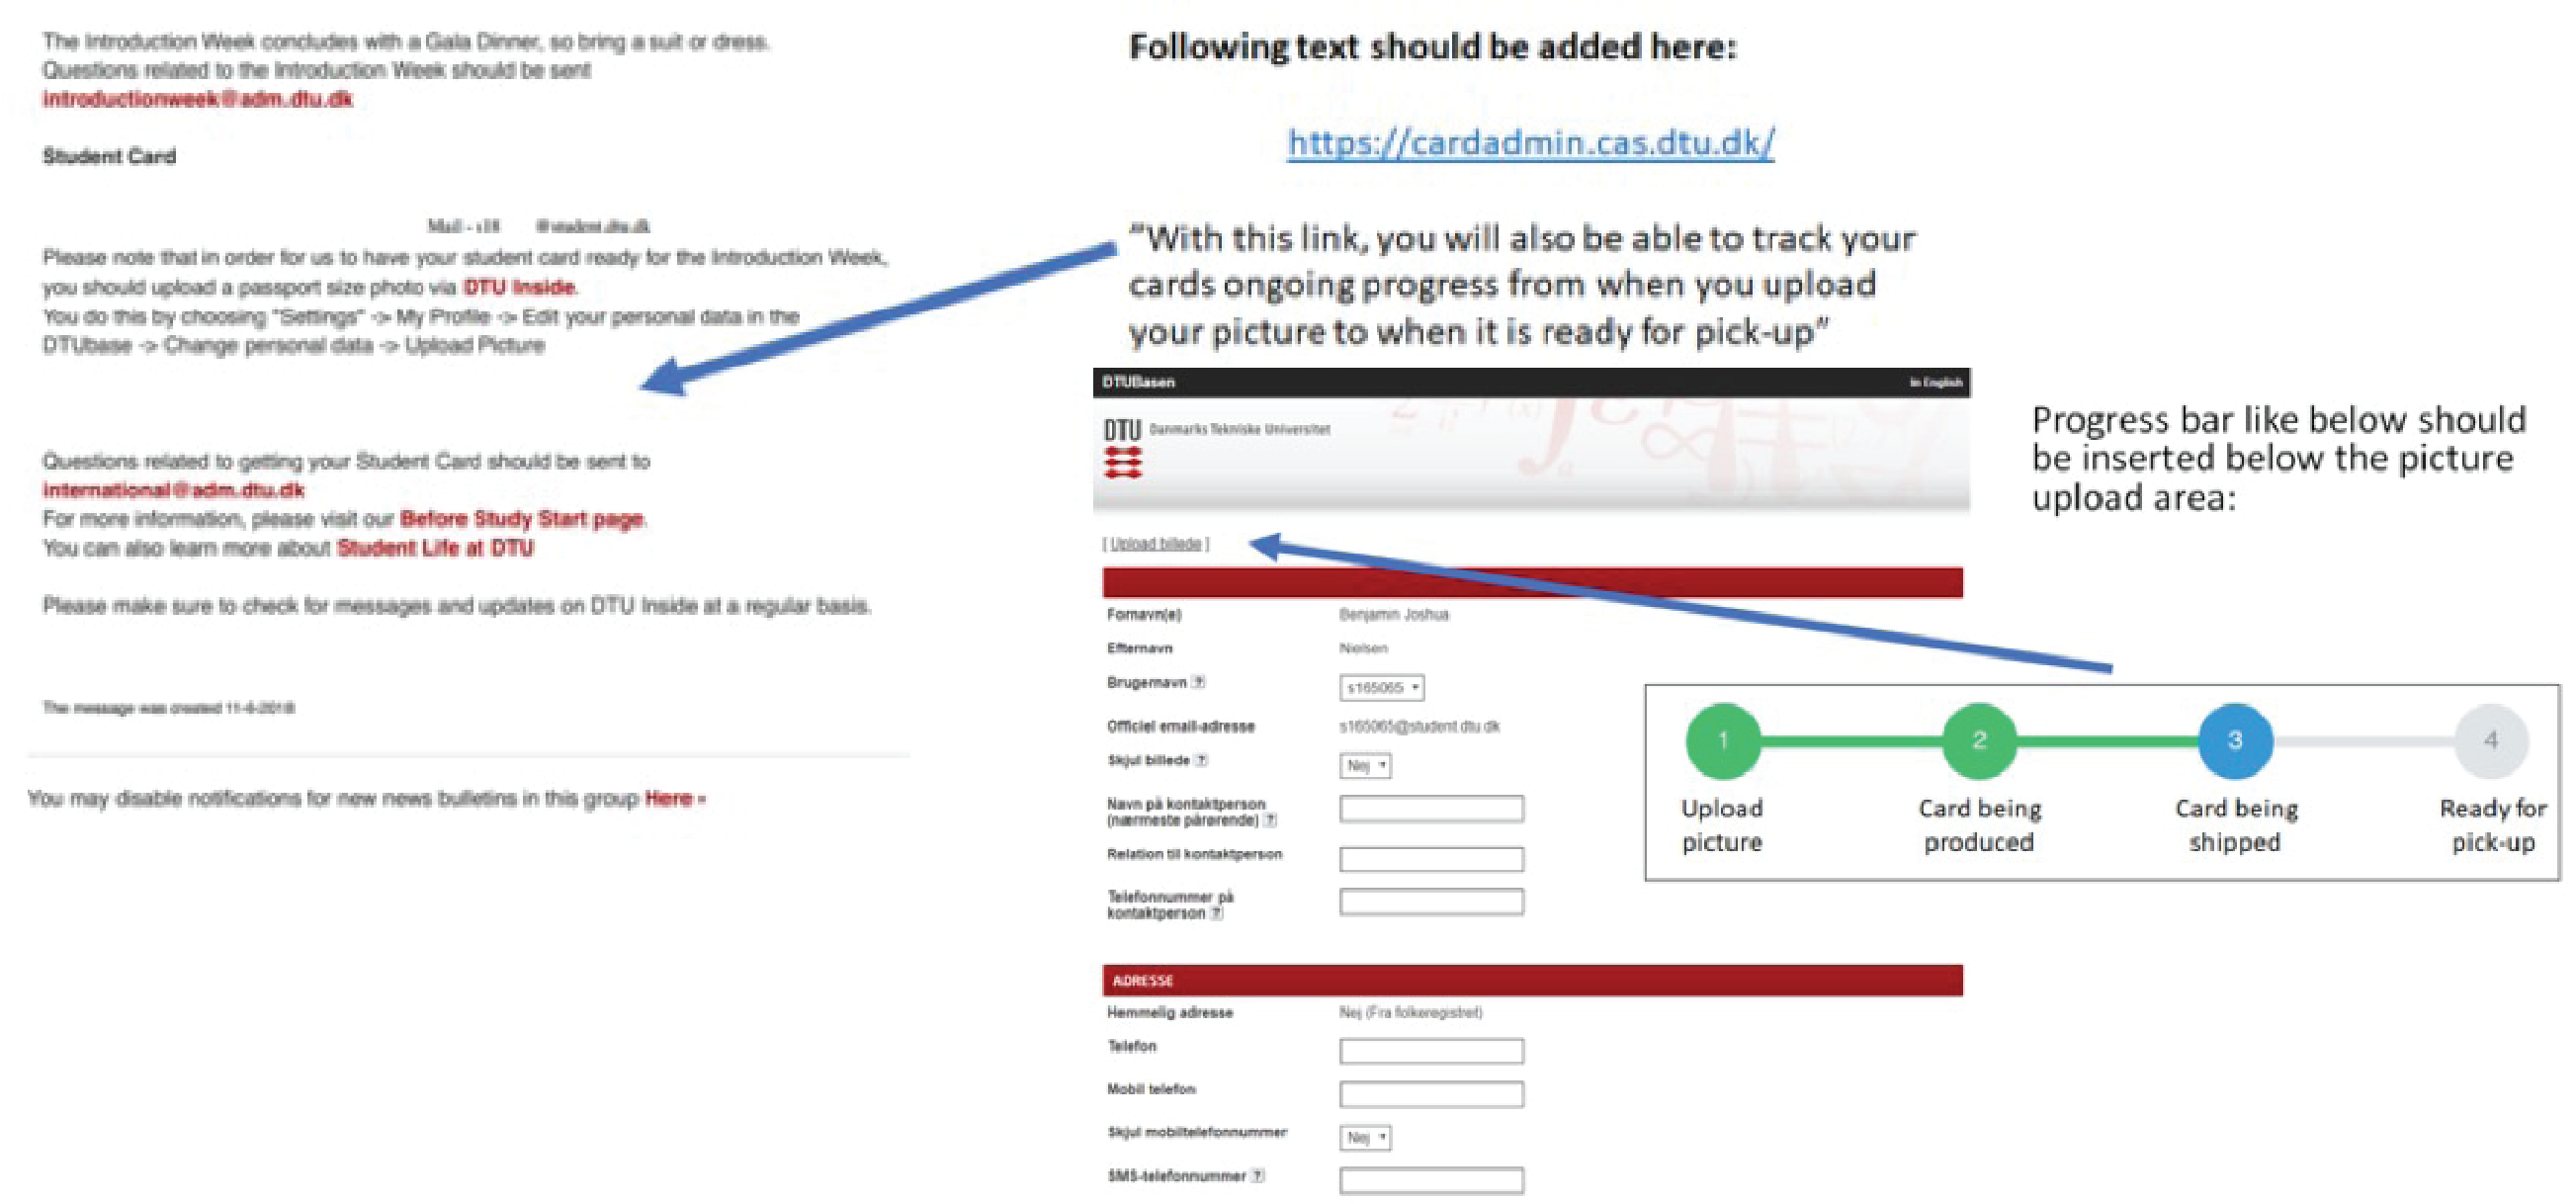
Make the picture upload a mandatory part of the application for international students and provide information of the card status in the same page where the picture is uploaded.
Breakdown 4
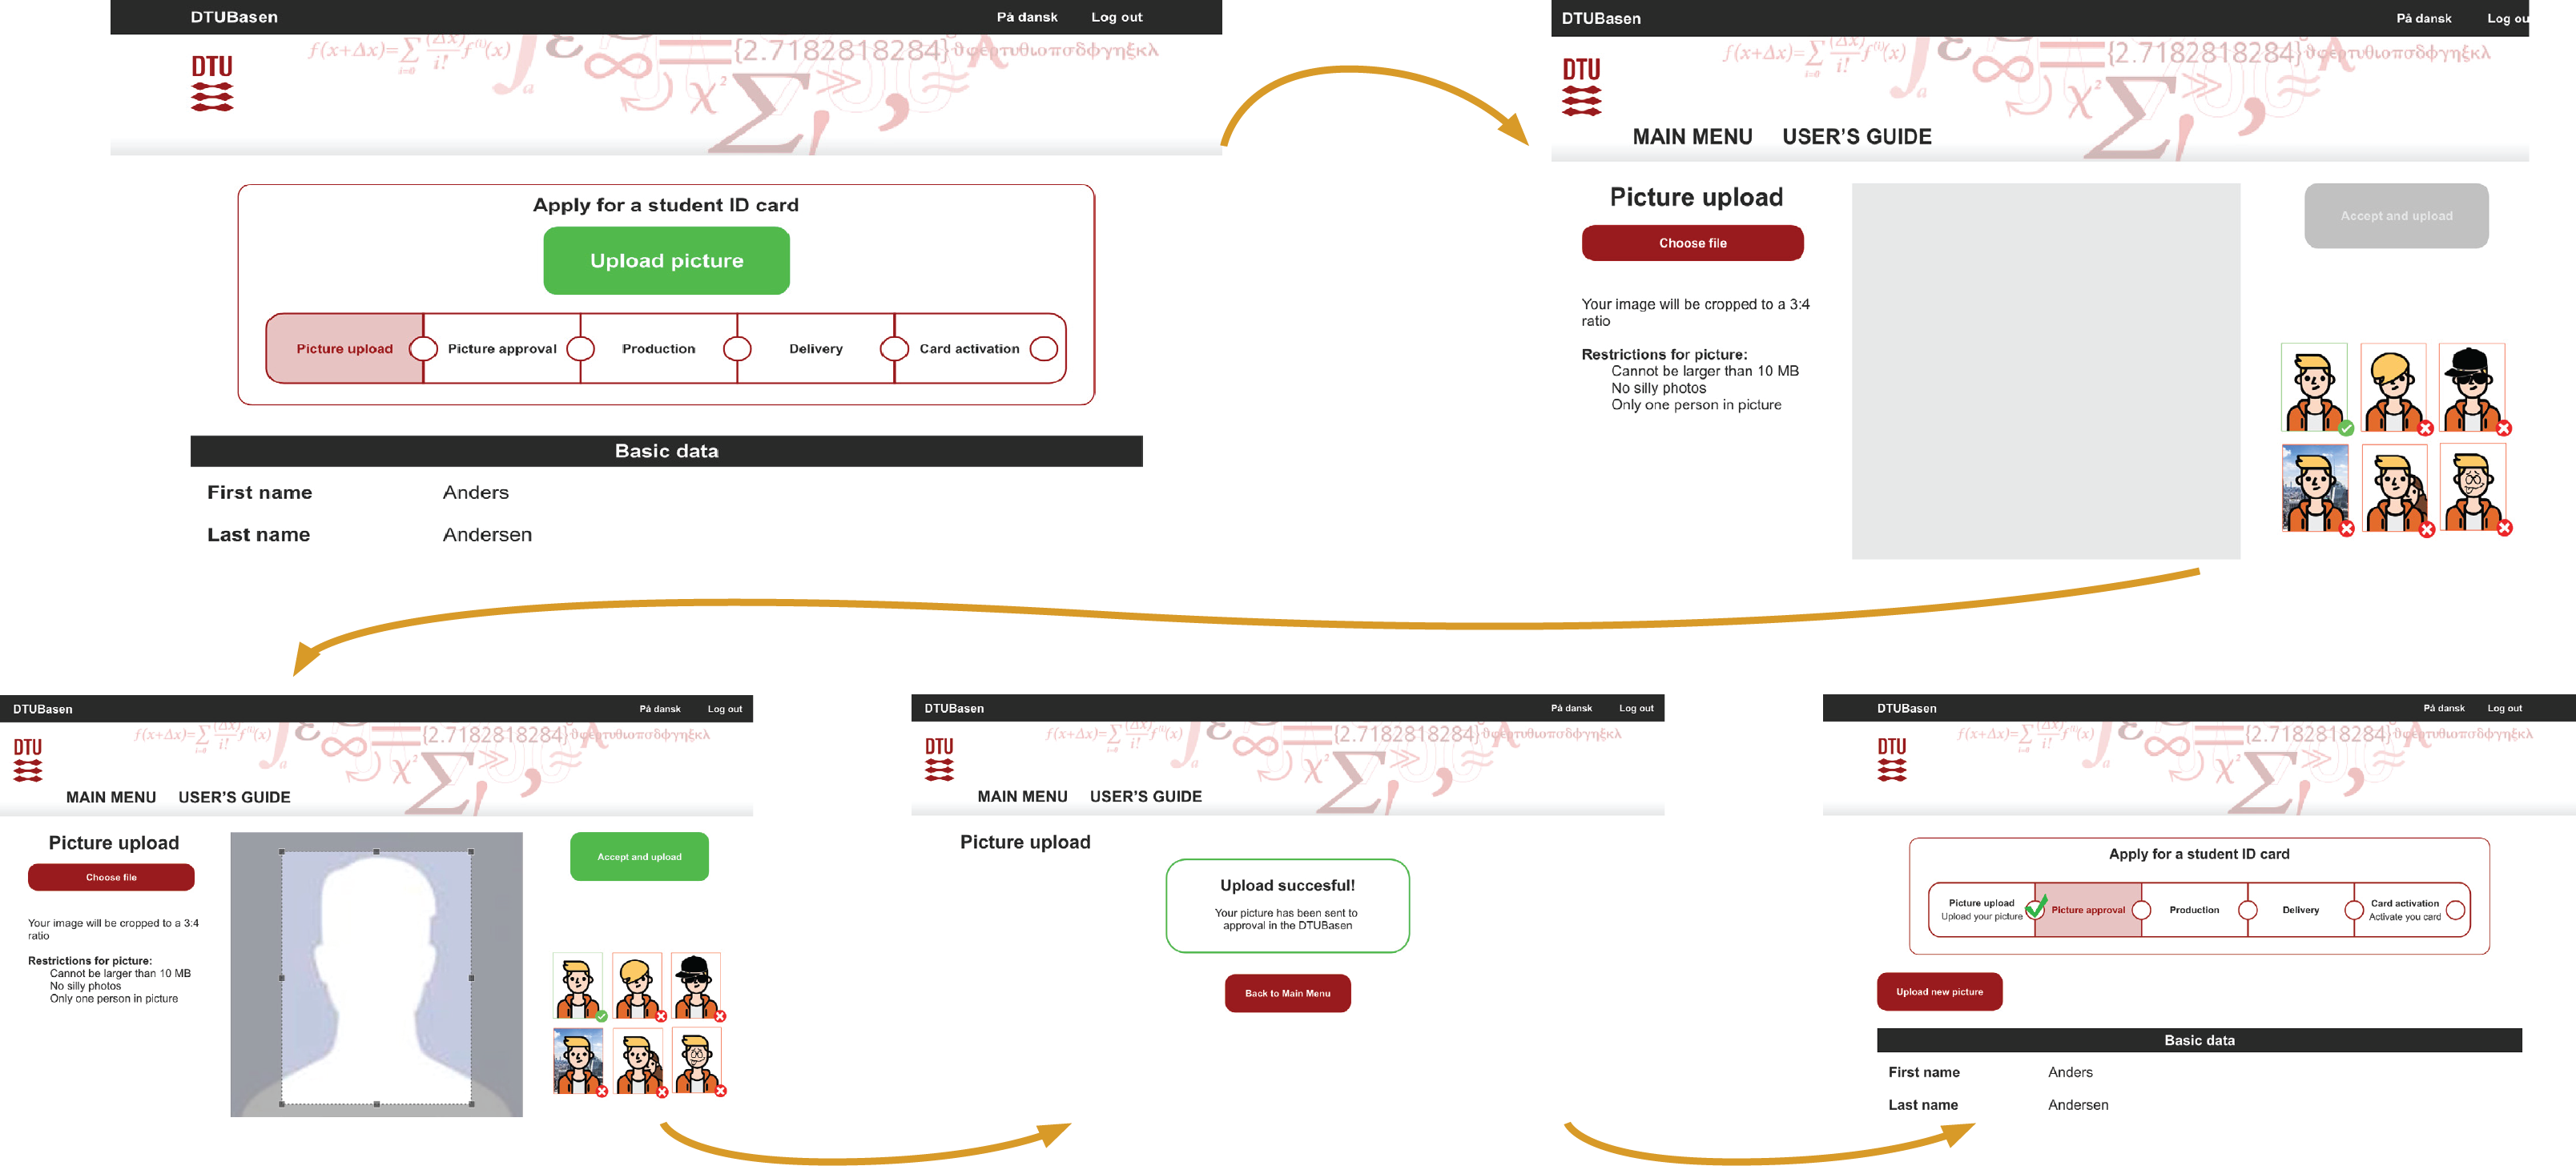
Redesign the webpage where the student should upload the picture. The main improvements are:
- Make the upload button more visible with color and centering it
- Include progress bar (solution from breakdown 3)
- visualize picture requirements
- Show cropping immediately
Breakdown 5
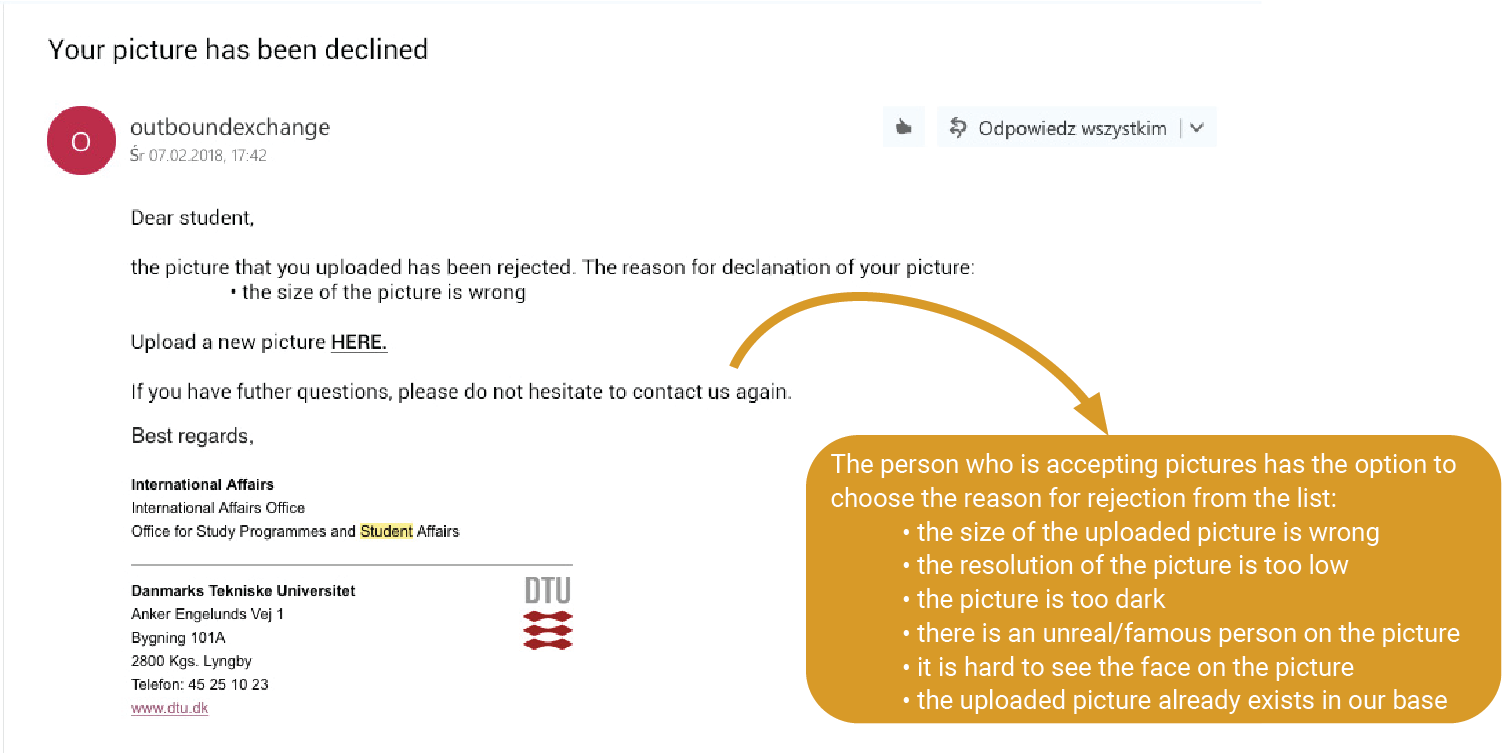
An email with information is generated automatically when the person clicks the reason for rejection. After clicking the link in the message, the student is redirected to “Upload a picture” webpage.
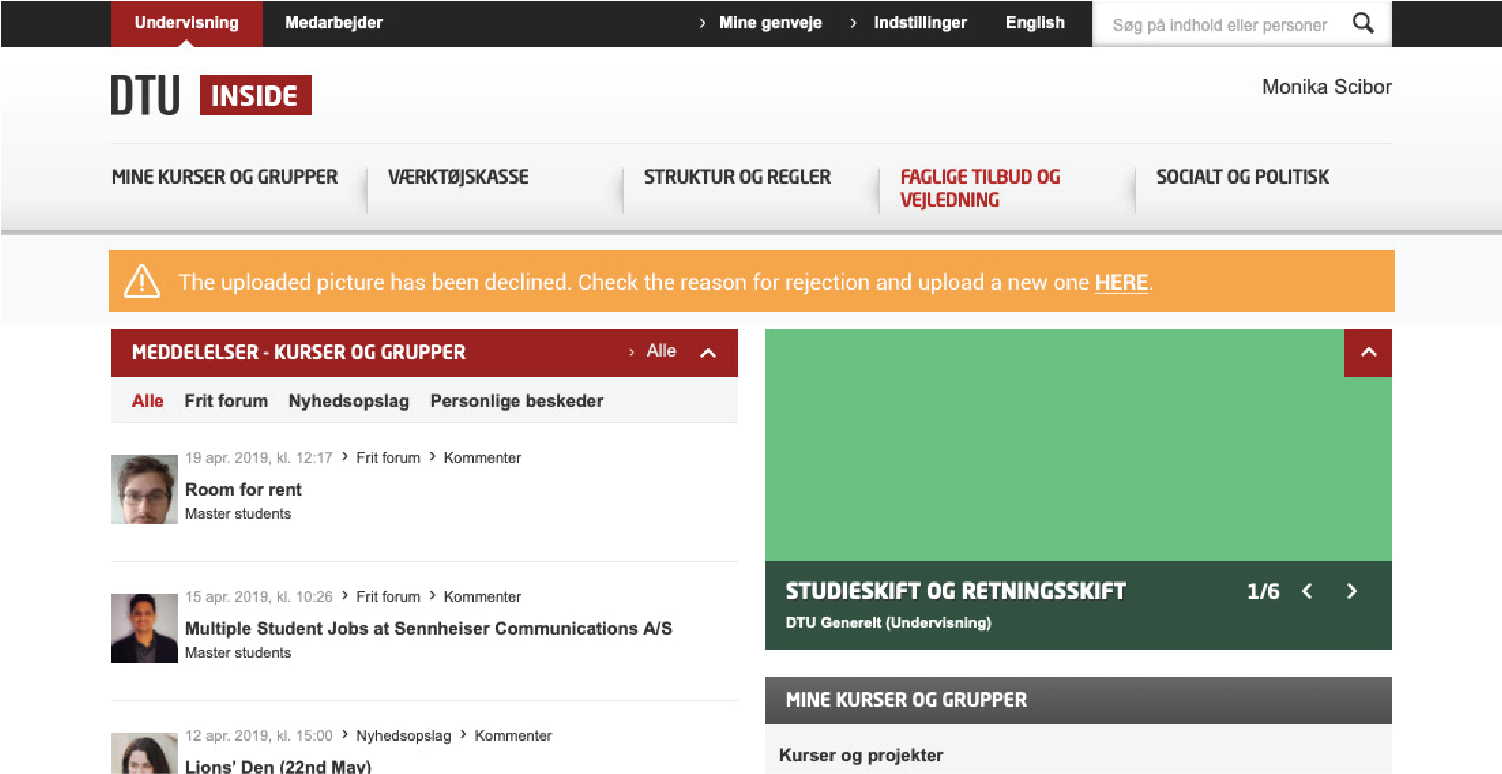
A pop-up with a simple message appears informing that the picture has been declined. When the “HERE” button is clicked, the student is redirected to “Upload a picture” webpage.
Breakdowns 6&7
Cards are received by DTU in stacks with QR code. QR is scanned and an automatic mail is generated for all the students of the stack, notifying that the card is ready to pick up. The letter is suppressed and instead, included in the mail.
The cards are alphabetically stored in a card organizer until the student picks them up.
The Swimlane Diagram of the Redesigned System
Only 3 parties responsible for the process due to simplification and giving international office more responsibilities (authorization to check and approve/disapprove the pictures).
There are less activities due to simplification and clarification throughout the process (clarification if picture is accepted or not and mentioned what needs to be improved if not accepted also link to check status is directly available and in- formation is shared through inside).
The amount of manual tasks is reduced (such as folding the letters and entering the mail addresses in the system).

Testing
We performed qualitative testing with 4 students for the redesigned webpage for uploading the picture:
- All said the new version was much easier
- Liked the visible upload button, progress bar and that cropping was made obvious
- Were generally quicker with new version
We performed quantitative testing with 12 students for the redesigned webpage for uploading the picture. We computed the average time to complete the task:
- Current system: 27 seconds
- Redesigned system: 12 seconds
Long Term Solution
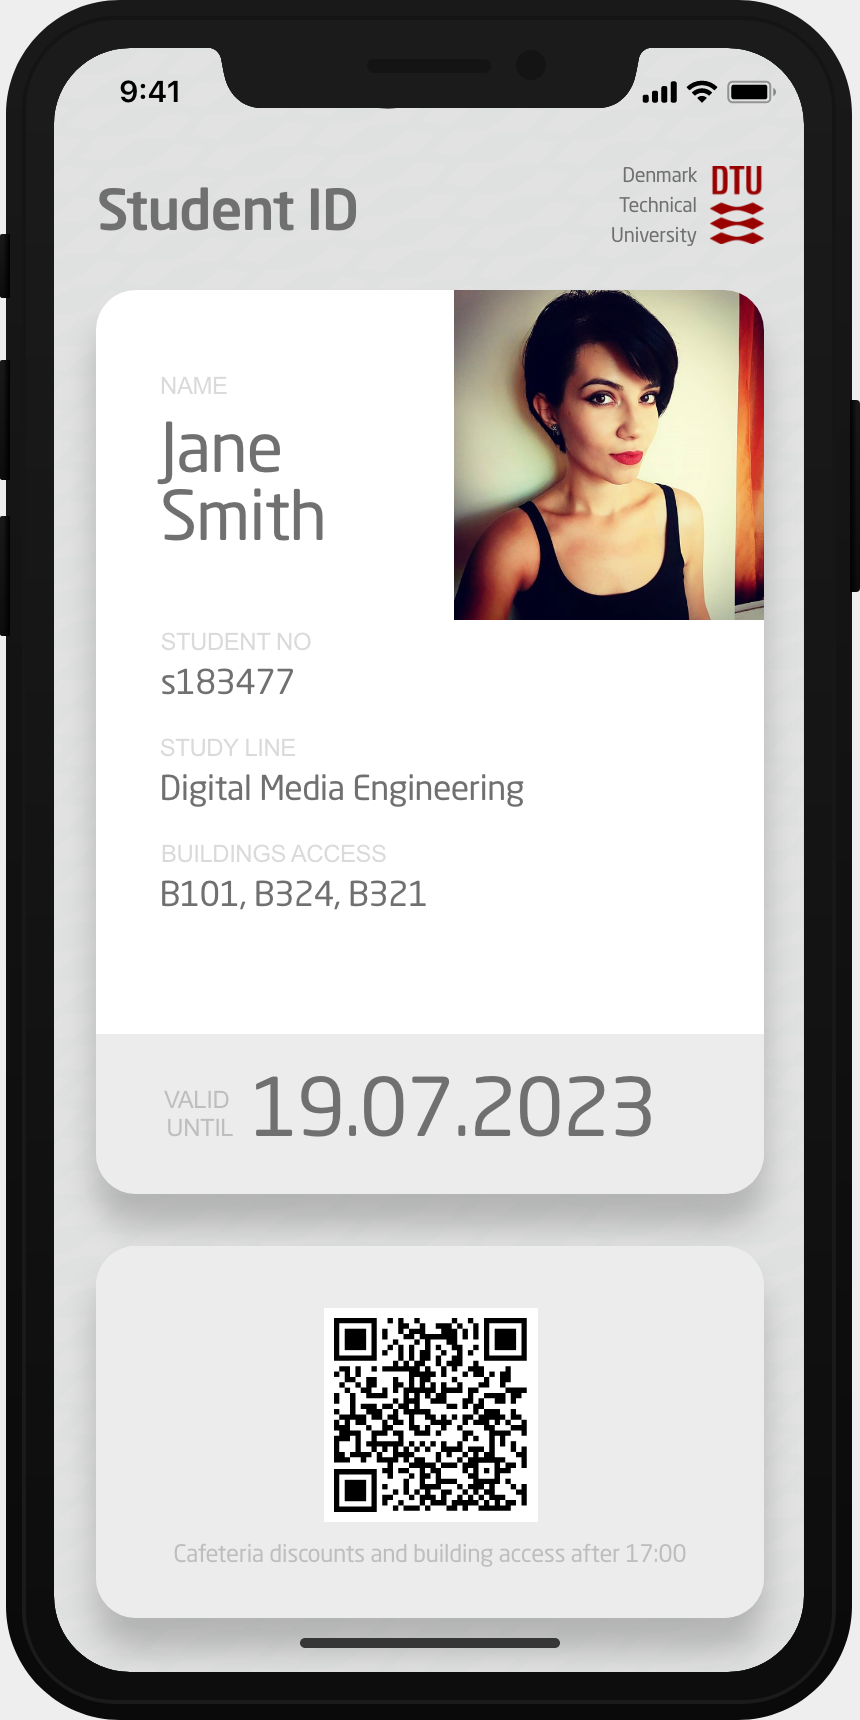
The long term solution we suggested, besides using software to analyse and approve the pictures, is digitalising the student IDs. A mobile application is the best choice, as most of DTU's students have mobile phones and carry them around all the time. There will still be the option to have the physical card for the ones that want it, but there will be a fee for it.
Why did we suggest this?
- The solution is a sustainable option compared to the physical cards.
- It would save DTU a lot of financial and human resources, because all the steps with printing, delivery, distributing would be removed from the system.
- Physical cards can be easily misplaced or the RFID chip can be broken.
The mockup follows DTU's design guidelines.
Redesign Goals & KPIs
- Reduce waiting time for student to get card
- < 1.5 weeks
- Reduce time between intro email and card application
- % of students that upload within a week of receiving the email; decreasing amount of urgent cards needed for exam
- Reduce manual tasks within the process
- Reduce amount of tasks and human errors
- Improve cognitive ergonomics for uploading picture
- Time to complete task
Delivering to stakeholders
We delivered a presentation to the stakeholders from the International and Administration Offices in DTU, explaining the process we found out. We used the models we created in order to illustrate the current processes in the system and the redesigned version.
The stakeholders were surprised about the tangled process and said our research is valuable to them and that they will take into consideration implementing our solutions