Rejsekort Usability Evaluation
A case study of Denmark's transportation system usability.
Project details
Duration: 3 months (spring 2019)
Group: 4 people
Used tools
SUS
NPS, Key Driver Analysis
Correlation Matrix
Survey
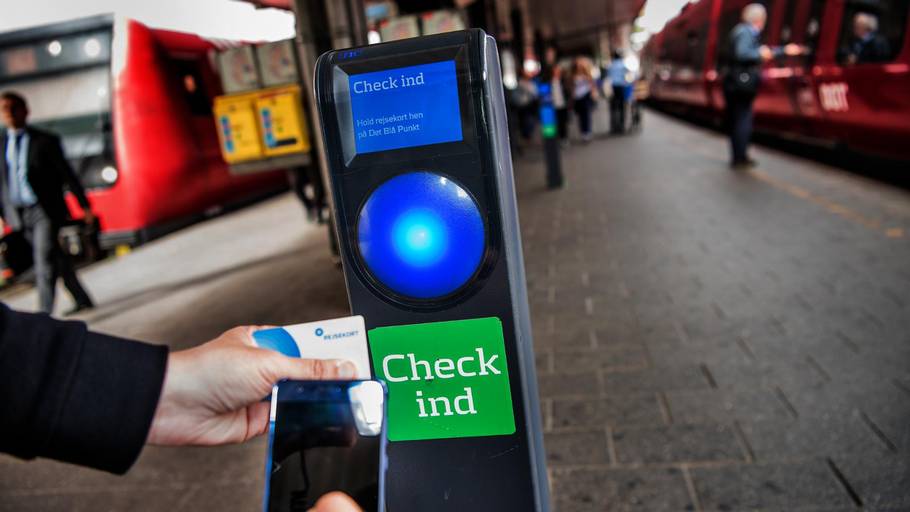
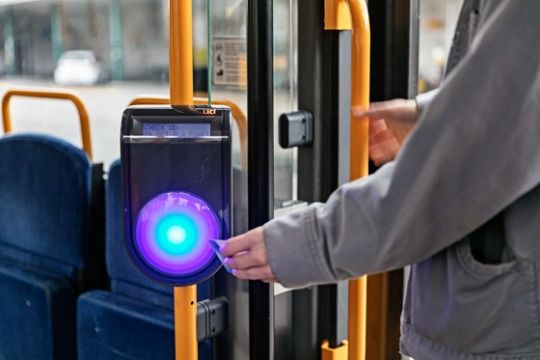
Check in point in the train station.
Context
Rejsekort is currently the ticketing system used in public transport in Denmark, introduced in 2012. The system covers travelling by train, Metro and busses all around the country. The electronic ticketing system Rejsekort was a replacement to the paper-based “Klippekort”.
The user has to check in when starting the trip and check out when ending the trip. The check-in and out is done with a personal card (Rejsekort) either inside the busses or at train stations at check-in/out points. With Rejsekort the user can combine transportation by bus, train and metro by checking in each time when entering a new transportation device. If the user forgets to check out a fine is drawn from the card balance.
Many people depend on Rejsekort everyday when getting from A to B. Since there is no alternative as cheap as Rejsekort, there are high expectations of the reliability and stability of the system. These expectations are not always met because the system depends on certain activities that the user might do wrong or forget. This includes forgetting to check in or out or realising that the card balance is low when it is too late. How can these issues in the usability of Rejsekort be explained and does the exposure effect increase the user satisfaction?
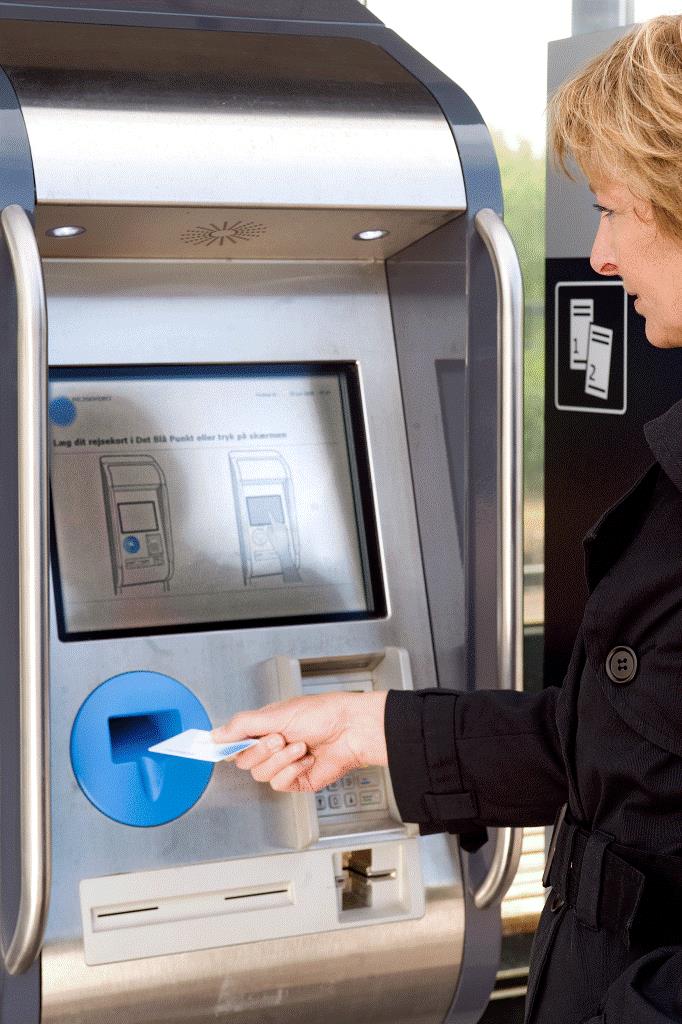
Kiosk to check status/recharge the card.
Project Goal
The main objective of this case study was to gather insights into the usability and satisfaction of the Rejsekort system and evaluate the collected data with statistical analysis.
What did we use?Methodology
The research is based on quantitative academic research and statistical analysis. An online survey was conducted on a sample of 104 participants. The survey had questions related to the respondents profiles (age, gender, education, occupation), how they use the system, SUS and NPS questions.
Historical data from the survey from years 2018, 2017 and 2016 was also available.
Demographic Analysis
The survey had 104 respondents out of which 57 males, 43 females (slightly unbalanced gender distribution). Ages varied from 18 to 55 with an average of 25.07 years and median of 24.


Gender and age distributions of the sample
Looking at the Danish population statistics, there are 49.6% males and 50.4% females, with average age of 41.7. Therefore, the findings cannot be generalised for the entire population, because the sample is far from the actual population. (The confidence interval of the sample ages is [24.05, 26.08], whereas the population average of 41.7 does not fall into that interval.)
It can be seen that there were 53 Bachelor level, 15 Master level, 1 PhD level and 35 lower education. This can be correlated to the occupation of the participants, where 84 were students.


Occupation and Education level distribution of the sample
System Usability Scale Analysis
The SUS (System Usability Scale) was used to assess the perceived usability of the Rejsekort system in 2019 and then compared with the data from previous years.
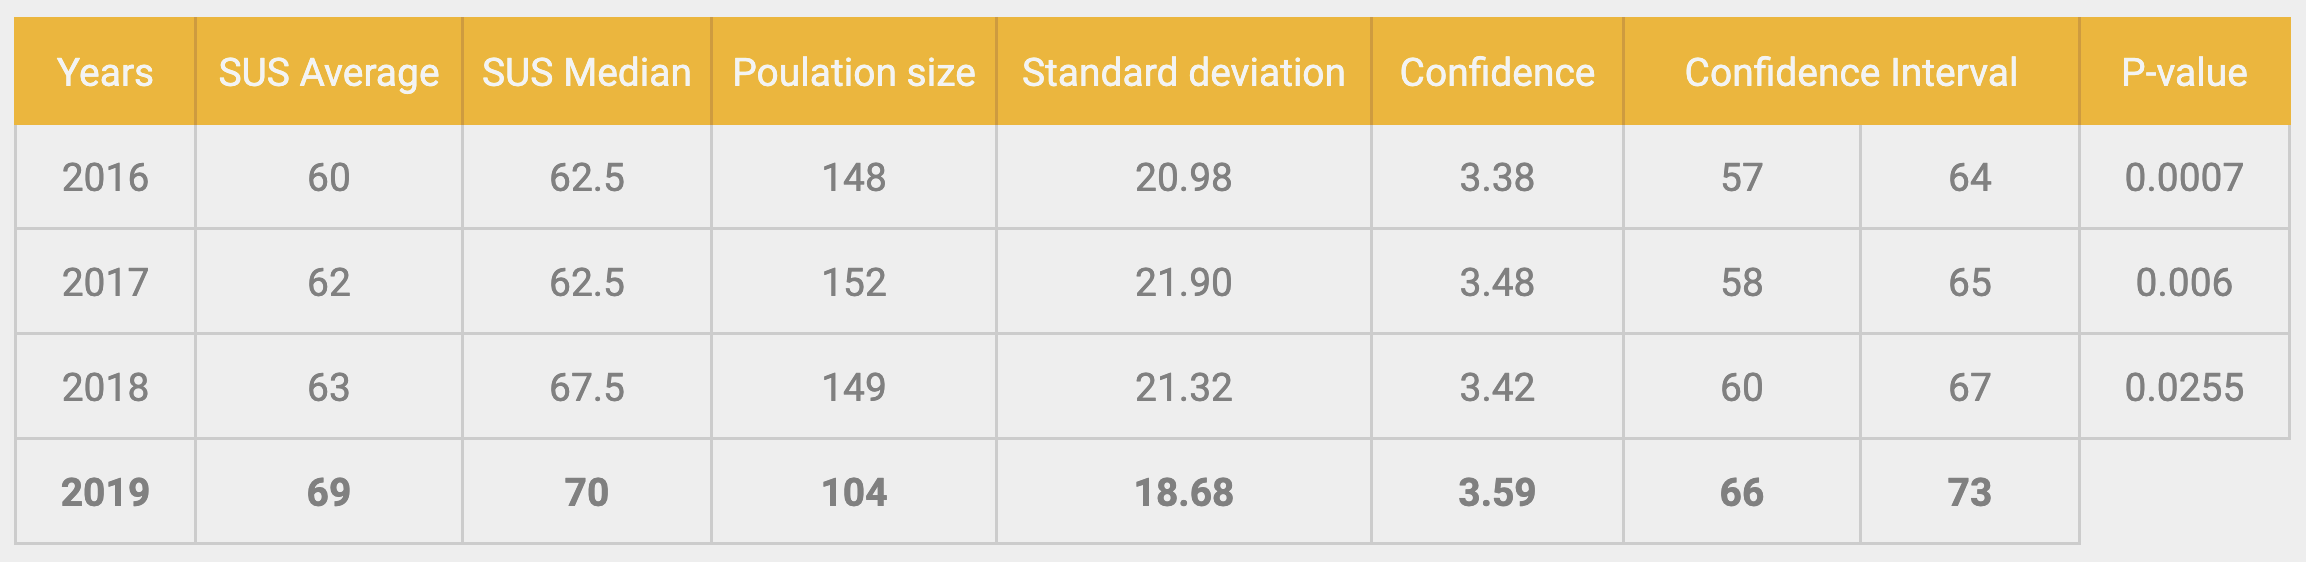
SUS score, where P-value represents the comparison of 2019 data with the other years
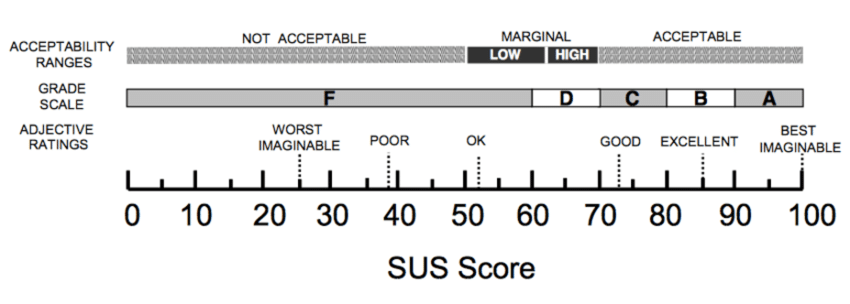
SUS ranking using an adjective ranking scale (by A. Bangor et al)
In 2019, for the given sample size, the Rejsekort system scored 69 on average, with a confidence interval between 66 and 73. Therefore, it is 95% certain that the score is in this interval. This means, using the adjective ratings, that the Rejsekort system is OK, almost GOOD.
Compared to the previous years, the SUS score is relatively similar, but the one from 2019 is statistically significantly higher, especially when comparing 2016 to 2019 where the P-value is 0.0007 (extremely statistically significant).

Histogram of SUS over the years
This can mean that the users got used to the Rejsekort system over the years. But taking into consideration that the respondents of the survey are most probably different all the years, as the survey is spread by students to their network that mainly consists of students that change every year, it cannot be said that an exposure effect is occurring. Therefore, the conclusion is that the Rejsekort system has improved over the years.
Usability of short term users vs long term users
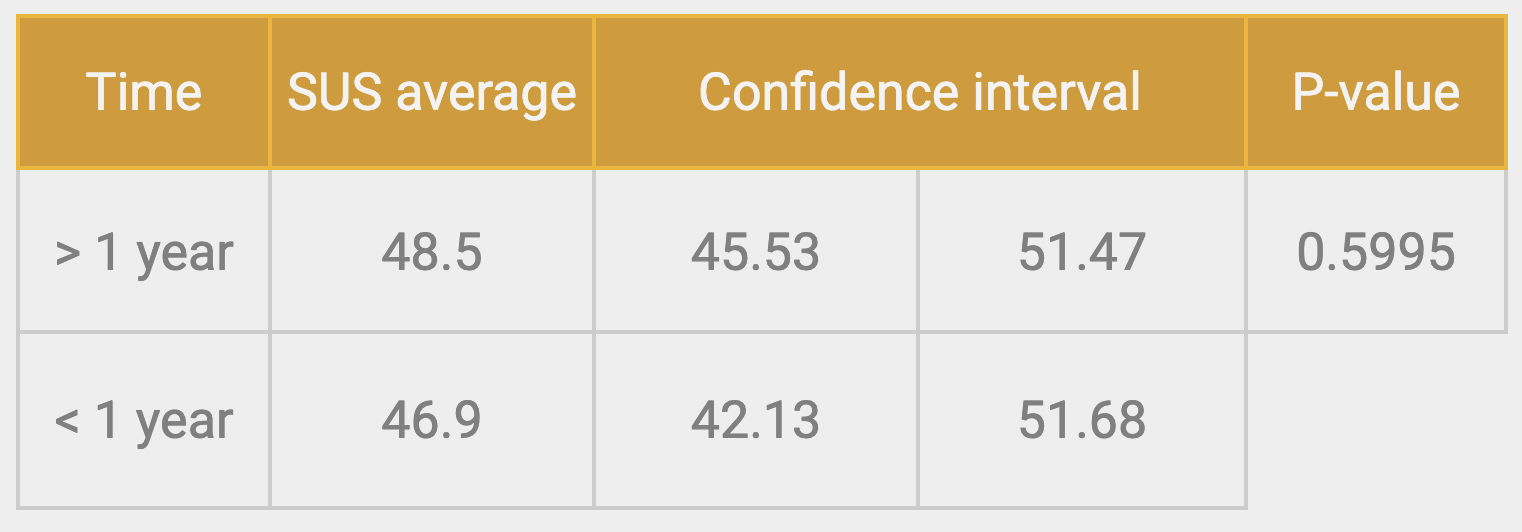
Comparison on more and less than one year of use
Hypothesis: Exposure effect. Long term users tend to have a higher perceived usability than the short term users.
The hypothesis is based on the idea that people that used the system more tend to make less mistakes because they are used to the functionalities and artefacts of the system, therefore giving higher scores.
Result: In order to validate or invalidate the assumption, people that used the system more than 1 year were compared with people that used the system less than 1 year.
Based on the P-value > 0.05, the two compared groups are not statistically significant, therefore the hypothesis turned out to be false.
“Tank op” agreement activated vs not activated
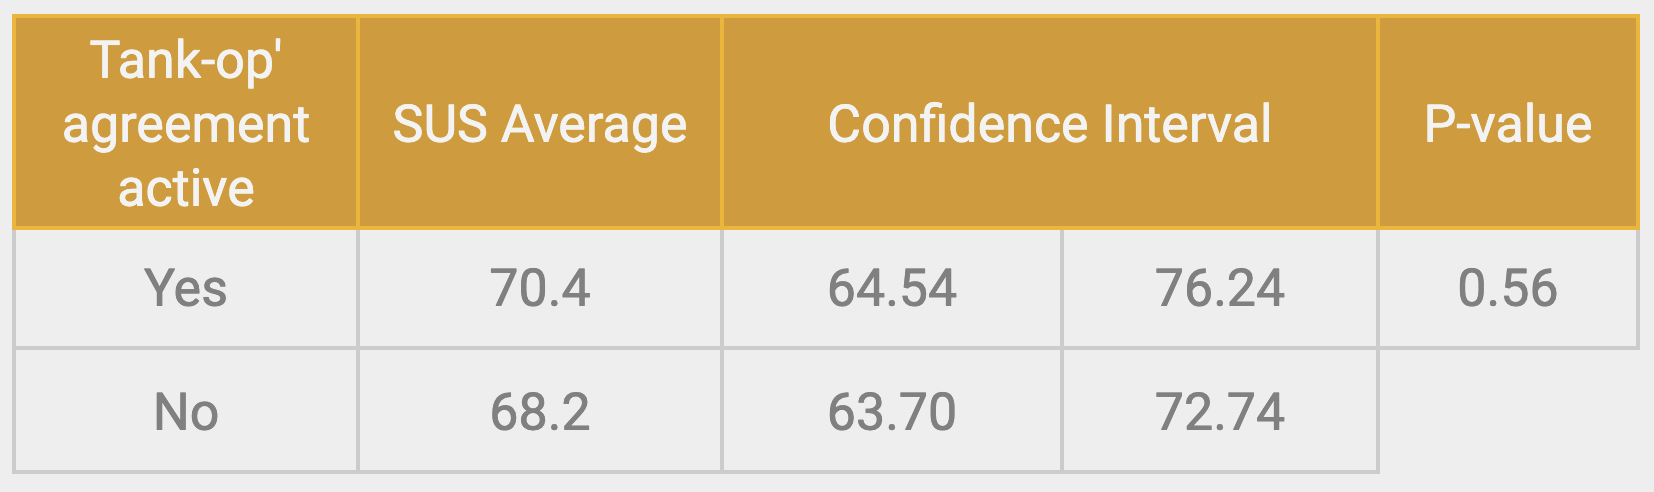
Comparison whether users have automatic recharge agreement active or not
Hypothesis: Users that have the “Tank op” agreement active give a higher score than the ones who do not have it.
The hypothesis is based on the logic that the people that have the agreement activated do not have to worry about adding money to the card, having to find a kiosk in order to do it and so on.
Result: In order to validate or invalidate the assumption, the two groups were compared. Based on the P-value > 0.05, the two compared groups are not statistically significant, therefore the hypothesis turned out to be false.
Key Driver Analysis
Net Promoter Score
Net Promoter Score (NPS) analysis was done in order to understand the underlying loyalty of the Rejsekort customers. For 2019, the net promoter score was 5.77%. Comparing the NPS over the last three years shows a positive evolution.
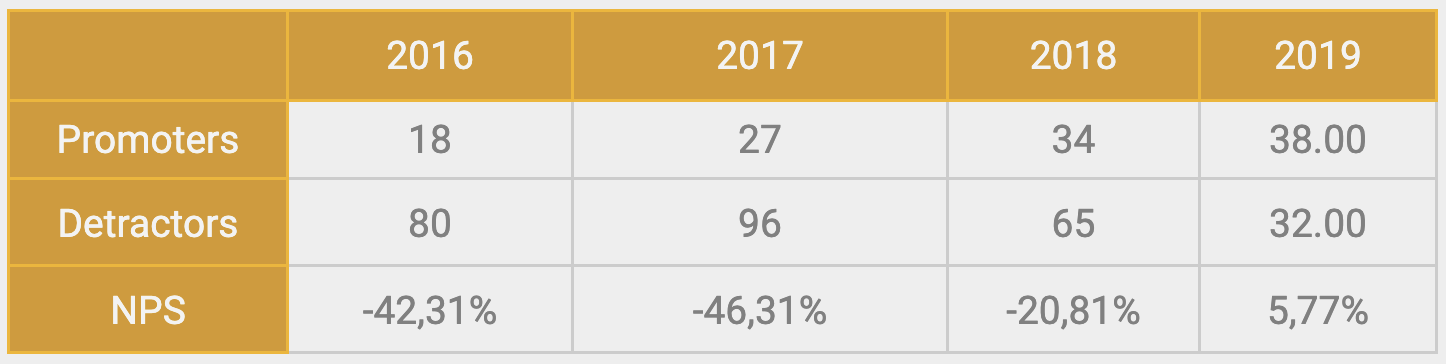
NPS score over years
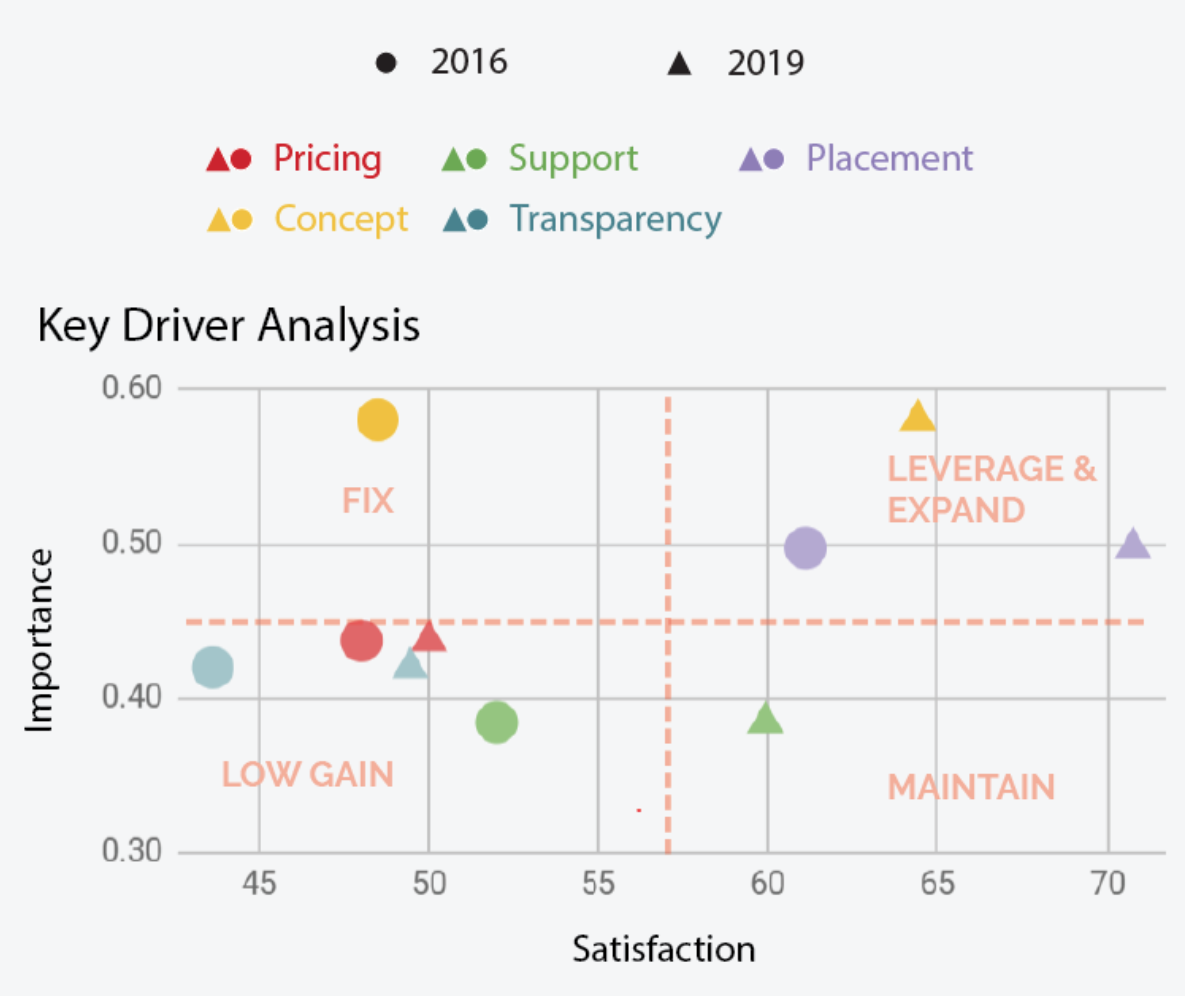
Key Driver Analysis - a correlation (the importance) between each of the concepts and the net promoter score (satisfaction)
Satisfaction parameters
The different considered satisfaction parameters are:
- Prices & Benefits:
- Are users satisfied with the prices and benefits of Rejsekort?
- Check-in concept:
- Are users satisfied with the concept of check-in, re-check-in for transfers and check-out?
- Customer Support:
- Are users satisfied with the customer support through website and hotline?
- Price transparency:
- Are users satisfied with the transparency of the prices?
- Terminal placement:
- Are users satisfied with the physical placement of check-in/out terminals in stations and busses?
The analysis pointed out that the system has improved over the years. The most significant change can be seen in the concept: in 2016 it had low satisfaction, whereas in 2019 the satisfaction rose considerably. What can be improved is the transparency of the prices, meaning that the amount people pay for a journey are not very well described, therefore sometimes they don’t know exactly how much they should pay. People are also not satisfied with the prices of the system.
In conclusion, Rejsekort has to leverage and expand their check-in/out concept and the placement of the terminals in order to ensure further growth in user satisfaction. Afterwards the pricing and related transparency can be looked at, which are low gainers.
Correlation Matrix
In order to identify a data driven hypotheses, a correlation matrix was used.
The correlation matrix validates that the customer loyality (NPS) is strongly related to the satisfaction of the users (SUS).
The correlations discussed next are: Number of times people have run out of money on the card in correlation to three different factors:
- mistakes on checking out between transfers
- confusion by the chen-in/out sounds
- trouble finding a kiosk to refill the card
All three correlations’ values are close to 0.285. This shows that when people suddenly find out they are out of money, there can be several reasons that influence either equally or an equal amount of people from the survey.
When in correlation with mistakes on people checking out between transfers it can be assumed that it is an act of habit that causes users to check out because nobody wants to be fined for forgetting. When asking the busdriver if you have to check out between transfers the answer is always no. You should only check in again when entering a new vehicle within a certain time span. However, if you check out and check in again within that time span the trip sometimes continues anyway. But if the system is not connected to the cloud, it is not aware that you could continue the trip even though you accidentally checked out. If the balance on the card is too low, the user cannot travel, even though they could have continued an already started trip. This might be the reason why people suddenly realise that they have a low balance.
When in correlation to confusion about the check in/out sound a reason could be that many people do not have a “tank op” agreement. When checking out, the screen always tells the balance, but people are in a hurry and the balance is only displayed shortly, so if the user forgets to look, they are most of the time unaware of the card balance. Furthermore, the user cannot read the balance from the card alone because it is just a piece of plastic. The user could check the balance at a kiosk, but this is where the last correlation comes into the picture.
There also is a correlation between the number of times people have run out of money on the card and trouble finding a kiosk. This could be caused by limited time when taking public transport. People are most likely only arriving just in short time for their departure and in between transfers there is usually also very limited time - at least if people follow the trip instructed by Rejseplanen, an application planning you trip from A to B no matter the amount of transfers. Another reason why there could be a strong correlation to trouble finding a kiosk is that the kiosks are only present on train stations and metro stations. If the user starts the trip in a bus there is no kiosk and if this is the point where he finds out that the balance is too low to start a trip there is not much else to do than to buy a mobile ticket instead.
Bus check in points are located inside the busses. (picture from bornholm.nu)
Suggestions for improvements
A more accessible, recognisable and memorable check-out system would be thoroughly advantageous, particularly on busses. The high proportion of users from the survey that reported they have failed to check out several times, along with correlation with the users who have not transferred properly on their journeys, suggests there is room for improvement with the check-in/out posts. The exact specification for this improvement would need investigating, but the findings from this research show this could be an effective change.
Another issue identified in the study, which also has prevalence in busses, was users running out of credit on their rejsekort without knowing. Couple this problem with the high correlation to users having difficulty finding a kiosk and you have a potential source of frustration. One solution to this could be to facilitate topping up via an application or at a kiosk on the bus itself. It is understandable that the development of such a solution could be costly, but it would provide a great deal of flexibility for users, especially those whose regular commute is from bus stop to bus stop and does encounter a kiosk. This issue could also be circumnavigated if the user could use an app to pay into the rejsekort system directly. They could top up their account on the app anytime and the app could even have additional functionality, such as: reminders to check in/out, reminders to transfer properly and integration with rejseplanen for journey planning.
These suggestions, as with any change to a system, would need further examination, prototyping and thorough implementation.
Learnings
Choose your survey respondets carefully. When using surveys for the analysis of a system, you should make all the efforts to receive answers from people that are relevant for the population you are analysing. Our sample consisted mainly of students and it was not representative for the Danish population, therefore the results cannot be generalised for the entire population.